Executive Reporting PowerPoint
Present monthly results with an editable scorecard, trend chart, backlog bridge, decisions and action plan.
Sold individually. This product is not included in the existing toolkits or Ultimate Bundle.
What you can do with it
- Eight editable 16:9 slide layouts
- Blank deck and complete fictional operations review
- Native chart with editable data and native tables
- Speaker-note instructions and example reconciliation data
What is included
Version 1.0 · one ZIP download · 57 KB
See every included filename (6 files)
CONTENTS.txtExample-Monthly-Controls.csvExecutive-Reporting-Blank.pptxExecutive-Reporting-Example.pptxLICENSE.txtSTART-HERE.md
How to use it
- Open the Example deck to see a consistent August service-operations story, then save a copy of the Blank deck.
- Replace bracketed prompts, the organization, cutoff and audience. Use one reporting period and unit convention throughout.
- Edit table cells directly. For the trend chart, use PowerPoint Chart Design → Edit Data and replace categories and both series; blank chart zeros are placeholders.
The included guide continues with definitions, review steps and product-specific limits.
Before you choose
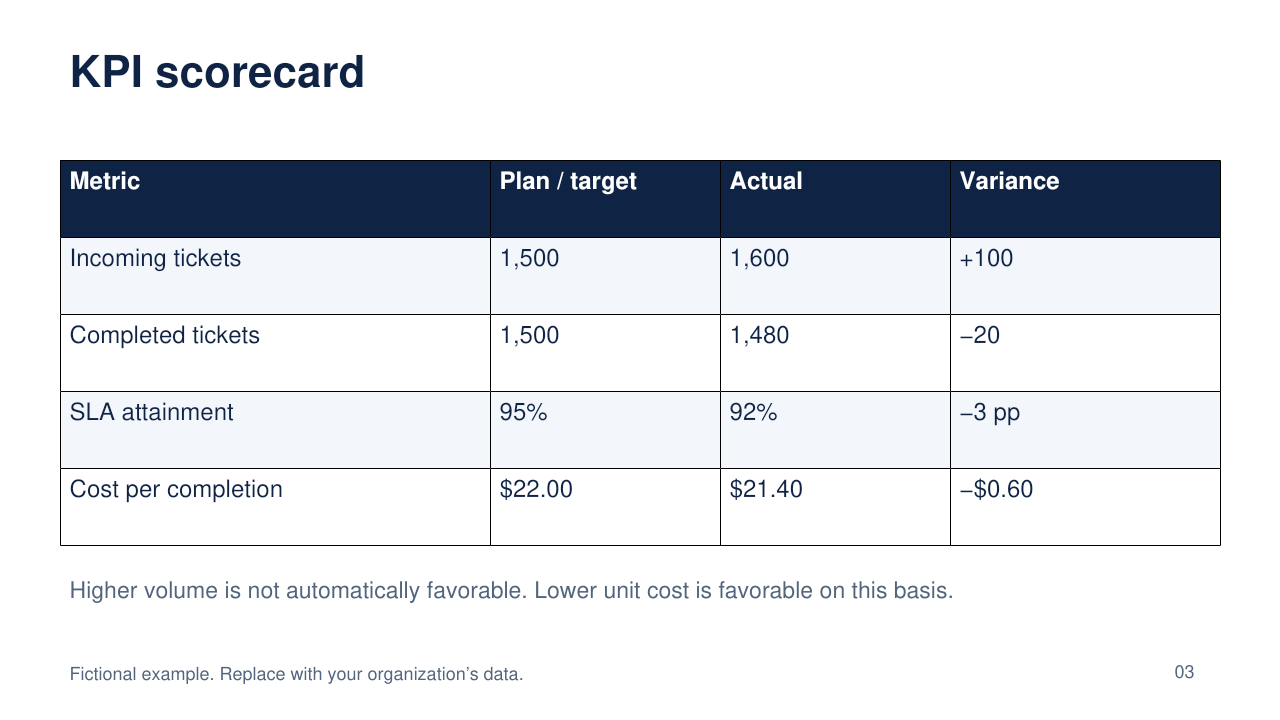
The example has opening backlog 220 + received 1,600 − completed 1,480 = closing backlog 340. The work-type changes 90 + 20 + 10 reconcile to the increase of 120.
Example SLA attainment of 92% is 3 percentage points below the 95% target, not a 3% relative difference.
Format and scope
PPTX designed for Microsoft PowerPoint, with Arial type and editable native tables and chart. Chart data is embedded, not connected to a source system.
Package integrity, editable-object presence, font and layout checks passed during authoring. Native Microsoft PowerPoint opening and export remain unverified.